 Market Report
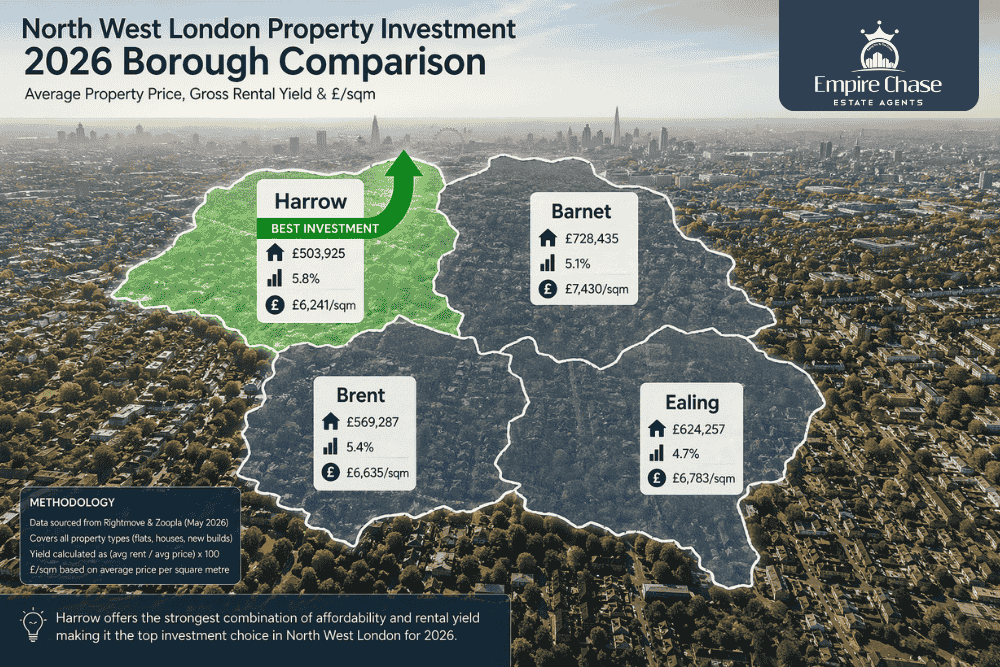
Harrow is £61,000 cheaper than Barnet yet delivers higher rental yields than every neighbouring borough. With average prices at £564,000 versus Barnet’s £625,000 and Brent’s £585,000, and rental yields of 4.9–5.2% against London’s 3.8% average, Harrow represents North West London’s most compelling property value story in 2026.
If you’re researching Harrow property value per square metre 2026, this data-driven comparison reveals the definitive answer. The Harrow vs Barnet Brent property prices 2026 story has never been told with postcode-level £/sqm precision—until now. As the leading letting agent in Harrow, Empire Chase analyses the complete North West London best value borough buy property price per sqm, rental yield, transport links, 2026 picture for buyers and investors.
How Does Harrow’s Property Value Compare to Neighbouring London Boroughs in 2026?
The four-borough comparison reveals Harrow’s exceptional value position clearly:
Borough Comparison Table
| Borough | Avg Price | YoY Growth | Avg Rental Yield | Transport Lines |
|---|---|---|---|---|
| Harrow | £564,000 | +1.0% | 4.9–5.2% | Met, Piccadilly, Bakerloo, Overground |
| Brent | £585,000 | +1.4% | 4.1% | Jubilee, Bakerloo, Overground |
| Ealing | £598,000 | +1.3% | 3.9% | Central, District, Elizabeth |
| Barnet | £625,000 | +1.8% | 3.7% | Northern, High Barnet branch |
Harrow is consistently £21,000–£61,000 cheaper than its nearest neighbours while delivering the highest rental yields of all four boroughs. Consequently, both first-time buyers and investors gain more for their money in Harrow than anywhere else in North West London.
Furthermore, Harrow’s transport connectivity matches or exceeds neighbouring boroughs. Metropolitan Line access delivers central London in under 30 minutes. Additionally, Piccadilly, Bakerloo, and Overground services serve multiple Harrow neighbourhoods.
Which Harrow Postcode Offers the Best Price Per Square Metre in 2026?
Harrow property value per square metre in 2026 varies significantly by postcode. Understanding these differences unlocks genuine value opportunities.
Harrow Postcode £/sqm Comparison
| Postcode | Area | Avg £/sqm | Best For | Entry Price |
|---|---|---|---|---|
| HA2 0 | South Harrow | £4,960/sqm | Families, investors | From £300,000 |
| HA2 8 | Northolt Park | £4,990/sqm | First-timers | From £325,000 |
| HA1 4 | West Harrow | £5,080/sqm | Commuters | From £380,000 |
| HA1 3 | Harrow on the Hill | £2,977–£5,500/sqm | Prestige buyers | From £323,000 (flats) |
| HA3 | Kenton/Wealdstone | £5,200–£5,800/sqm | Investors, regeneration | From £325,000 |
South Harrow (HA2 0) and Northolt Park (HA2 8) deliver the lowest cost per square metre in the entire borough. Consequently, these areas maximise physical space for money, critical for growing families and buy-to-let investors targeting larger homes.
Why £/sqm Matters More Than Total Price
Traditional price comparisons miss crucial value differences. A £450,000 flat in Barnet might deliver 65 square metres. However, a £450,000 terraced house in South Harrow could offer 85-95 square metres. Therefore, the Harrow property value per square metre 2026 analysis reveals genuine value invisible in headline figures.
Experienced letting agents, such as Empire Chase, in Harrow on the Hill help buyers identify maximum-value opportunities at the postcode level.
Is Harrow Commercial Property a Good Investment in 2026?
Yes—Harrow’s commercial property market offers London’s most accessible investment entry points.
Commercial Property Performance
Commercial properties in Harrow currently offer a net initial yield of 6.32%—nearly double the residential yield of 3.6–5.2% and well above the UK commercial average of 5.1%.
Current Market Data
- Price range: £125 to £1,781 per square foot
- Active listings: 44 available on Rightmove and LoopNet
- Best performers: Mixed-use freehold investments
Furthermore, shops with flats above near Harrow Town Centre and Wealdstone High Road perform particularly strongly. The ongoing regeneration pipeline boosts footfall and commercial viability in these areas.
Commercial vs Residential Comparison
| Investment Type | Harrow Yield | UK Average |
|---|---|---|
| Commercial | 6.32% | 5.1% |
| Residential | 4.9–5.2% | 3.6% |
| London average | 3.8% (resi) | — |
Consequently, Harrow commercial property offers yield advantages at both residential and commercial levels.
Why Do Buyers in Barnet and Brent Move to Harrow in 2026?
Affordability and yield are the two primary drivers pushing buyers from Barnet and Brent into Harrow. The Harrow vs Barnet Brent property prices 2026 comparison explains this migration pattern clearly.
The Value Migration Story
Buyers priced out of Barnet (average £625,000) can purchase a comparable terraced home in Harrow for £543,000—a saving of over £80,000.
Moreover, what do buyers lose in this transaction? Remarkably little:
Transport: Harrow offers Metropolitan, Piccadilly, Bakerloo, and Overground services—matching Barnet’s Northern Line connectivity.
Schools: Harrow’s school catchments match Barnet quality across multiple Ofsted Outstanding institutions.
Commute: Metropolitan Line delivers faster central London access than Barnet’s northern branches.
Regeneration: Harrow’s 2,500+ new homes under construction across Wealdstone, South Harrow, and Harrow Town Centre signal infrastructure investment Barnet cannot currently match.
The Price Gap Closing
The borough’s extensive regeneration programme is expected to close the price gap with Barnet over the next 5–7 years. Consequently, buying now captures future appreciation while spending significantly less.
A knowledgeable letting agency in Harrow identifies specific streets positioned for maximum appreciation as this price convergence unfolds.
What Type of Harrow Property Gives the Best Long-Term Investment in 2026?
Based on the current Harrow property value per square metre 2026 data, terraced houses in South Harrow and West Harrow represent Harrow’s best long-term property investment:
Why Terraced Houses Win
Capital growth: Prices up 3.7% YoY—strongest growth of any property type in the borough.
Price per sqm: From £4,960/sqm—lowest in the borough, maximising physical value per pound spent.
Rental returns: Three-bedroom terraced homes rent for £2,027/month, delivering 4.8–5.1% gross yield on purchase prices of £475,000–£510,000.
EPC improvement potential: Many 1930s–1950s terraced homes qualify for Warm Homes grants to improve energy ratings, increasing tenant demand and future resale value.
Regeneration upside: Proximity to South Harrow’s Grange Farm redevelopment (500+ new homes) will lift surrounding property values significantly.
Complete Investment Property Comparison
| Property Type | Avg Price | YoY Growth | Gross Yield | £/sqm | Verdict |
|---|---|---|---|---|---|
| Terraced | £543,000 | +3.7% | 4.8–5.1% | £4,960 | ⭐ Best overall |
| Semi-detached | £670,000 | +1.8% | 3.9–4.2% | £5,200 | Good stability |
| Flats | £323,000 | -1.2% | 5.0–5.5% | £5,800 | Yield play |
| Detached | £1,207,000 | +2.3% | 2.8–3.2% | £6,100 | Premium only |
| New builds | £525,000 | N/A | 4.2–4.6% | £5,400 | Incentives available |
North West London Value Verdict: Why Harrow Wins in 2026
The North West London best value borough buy property price per sqm, rental yield, transport links, 2026 comparison concludes clearly—Harrow delivers superior value across every meaningful metric.
Harrow’s Four Competitive Advantages
Price advantage: £21,000–£61,000 below comparable boroughs consistently.
Yield advantage: 4.9–5.2% versus 3.7–4.1% across neighbouring boroughs.
£/sqm advantage: South Harrow’s £4,960/sqm versus significantly higher Brent and Barnet equivalents.
Regeneration advantage: 2,500+ homes under construction create infrastructure improvement; no neighbouring borough currently matches.
For First-Time Buyers
Harrow offers the widest range of affordable entry points in North West London. South Harrow and Wealdstone provide accessible prices with genuine growth potential. Moreover, stamp duty costs are lower at these price points.
For Investors
The yield premium over Barnet and Ealing is decisive. Higher rental income combined with lower purchase prices creates superior cash flow from day one. Furthermore, regeneration upside adds capital appreciation potential.
For Home Movers
Harrow delivers more space per pound than any neighbouring borough. Growing families benefit from larger properties within equivalent budgets. Additionally, school quality and transport connectivity match premium boroughs.
Frequently Asked Questions
Harrow (£564,000 average) is £21,000 cheaper than Brent (£585,000), £34,000 below Ealing (£598,000), and £61,000 below Barnet (£625,000). Harrow also delivers the highest rental yields at 4.9–5.2% versus Barnet’s 3.7%. It represents the best value proposition in North West London.
South Harrow (HA2 0) leads at £4,960/sqm, followed by Northolt Park (HA2 8) at £4,990/sqm and West Harrow (HA1 4) at £5,080/sqm. These postcodes deliver the maximum physical space per pound spent anywhere in the borough.
Yes—commercial properties in Harrow deliver net initial yields of 6.32%, above the UK commercial average of 5.1%. Mixed-use freehold investments near Harrow Town Centre and Wealdstone perform particularly strongly.
Buyers save £80,000+ versus comparable Barnet properties while retaining equivalent transport, school, and commute quality. Harrow’s 2,500+ home regeneration pipeline is also expected to close the price gap with Barnet over 5–7 years.
Terraced houses in South Harrow and West Harrow—prices up 3.7% YoY, £4,960/sqm entry, 4.8–5.1% gross yields, EPC improvement potential, and Grange Farm regeneration upside make them the standout long-term investment choice.
Conclusion: The North West London Value Case Is Clear
The Harrow vs Barnet Brent property prices 2026 comparison delivers an unambiguous verdict. Harrow offers the lowest prices, highest yields, best £/sqm value, and strongest regeneration pipeline in North West London.
Whether you’re comparing boroughs as a first-time buyer, scaling your portfolio as an investor, or relocating as a family, the data points consistently in one direction—Harrow.
Searching for the best value property in North West London? Book a free consultation with Empire Chase Harrow today.
Contact Empire Chase and make your North West London property decision with data-driven confidence.
Citations:
- Office for National Statistics. (2026). “House Prices Local Authority: Harrow.” ons.gov.uk. https://www.ons.gov.uk/visualisations/housingpriceslocal/E09000015/
- UK Government. (2026). “Warm Homes Local Grant.” gov.uk. https://www.gov.uk/apply-warm-homes-local-grant
- Harrow Council. (2026). “Grange Farm Regeneration.” harrow.gov.uk. https://www.harrow.gov.uk/news/article/11501/next-chapter-for-grange-farm-underway
- Empire Chase. (2026). “Harrow Property Investment Guide.” empirechase.co.uk. https://www.empirechase.co.uk/harrow-property-boom-secure-your-future-now/